

Running analytics directly in Cloudberry Database, rather than exporting data to a separate analytics engine, allows greater agility when exploring large data sets and much better performance due to parallelizing the analytic processes across all the segments.
A variety of power analytic tools is available for use with Cloudberry Database:
- MADlib, an open-source, MPP implementation of many analytic algorithms, available at http://madlib.apache.org/
- R statistical language
- SAS, in many forms, but especially with the SAS Accelerator for Cloudberry
- PMML, Predictive Modeling Markup Language
The exercises in this chapter introduce using MADlib with Cloudberry Database, using the FAA on-time data example dataset. You will examine scenarios comparing airlines and airports to learn whether there are significant relationships to be found.
In this lesson, you will use Apache Zeppelin to submit SQL statements to the Cloudberry Database. Apache Zeppelin is a web-based notebook that enables interactive data analytics. A PostgreSQL interpreter has been added to Zeppelin, so that it can now work directly with products such as Pivotal Cloudberry Database and Pivotal HDB.
Prepare Apache Zeppelin
-
Open a browser on your desktop and browse to
http://X.X.X.X:8080using the same IP address that you used for the ssh step. You will see the Apache Zepplin Welcome page.
-
Click Interpreter at the top of the Screen and scroll down to the psql section and press edit.
-
Edit the postgresql.url entry by adding tutorial to the end, so that it will connect to the tutorial database.
-
Click Save and then Hit OK to restart the Interpreter
-
Click on Create new note underneath the Notebook heading and type:
tutorial
-
Click "tutorial" to open the newly created notebook.
-
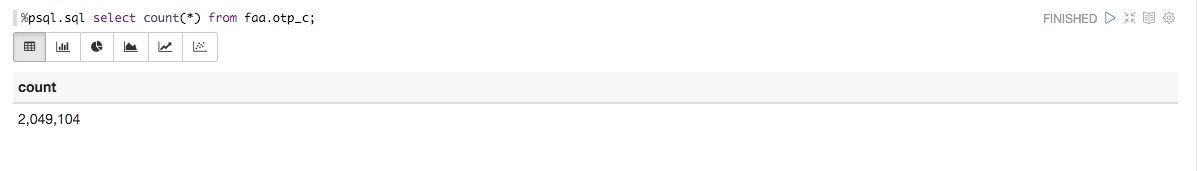
You should now see the the open notebook with a "paragraph" ready for input. Click in the the empty white rectangle (called paragraph) and type:
%psql.sql select count(*) from faa.otp.c;Then press the play button:

The result should look like the graphic below:
Run PostgreSQL built-in aggregates
PostgreSQL has built-in aggregate functions to get standard statistics on database columns—minimum, maximum, average, and standard deviation, for example. The functions take advantage of the Cloudberry Database MPP architecture, aggregating data on the segments and then assembling results on the master.
First, gather simple descriptive statistics on some of the data you will analyze with MADlib. The commands in this exercise are in the stats.sql script in the sample data directory.
-
Get average delay, standard deviation, and number of flights for USAir and Delta airlines. Click a new white rectangle and enter:
%psql.sql SELECT carrier, AVG(arrdelayminutes),STDDEV(arrdelayminutes),
COUNT(*) FROM faa.otp_c WHERE carrier = 'US' OR carrier = 'DL'
GROUP BY carrier;
Then press the Play button to execute the query.
-
Get average delay, standard deviation, and number of flights originating from Chicago O’Hare or Atlanta Hartsfield airports. Click a new white rectangle and enter:
%psql.sql SELECT origin, AVG(arrdelayminutes),STDDEV(arrdelayminutes),
COUNT(*) FROM faa.otp_c WHERE origin = 'ORD' OR origin = 'ATL'
GROUP BY origin;
Then press the Play button to execute the query.
-
Get average delay, standard deviation, and number of flights originating from Chicago O’Hare or Atlanta Hartsfield airports. Click a new white rectangle and enter:
%psql.sql SELECT origin, AVG(arrdelayminutes),STDDEV(arrdelayminutes),
COUNT(*) FROM faa.otp_c WHERE carrier = 'DL' AND origin IN ('ATL', 'MSP',
'DTW') GROUP BY origin;
Then press the Play button to execute the query.
-
Get average delay, standard deviation, and number of flights for Delta and USAir flights originating from Atlanta Harsfield. Click a new white rectangle and enter:
%psql.sql SELECT carrier, AVG(arrdelayminutes),STDDEV(arrdelayminutes),
COUNT(*) FROM faa.otp_c WHERE carrier IN ('DL', 'UA') AND origin = 'ATL'
GROUP BY carrier;
Then press the Play button to execute the query.
Run Apache MADlib ANOVA
ANOVA (Analysis of Variance) shows whether groups of samples are significantly different from each other. The MADlib ANOVA function uses an integer value to distinguish between the groups to compare and a column for the data. The groups we want to analyze in the FAA fact table are text in the data, so we use a PostgreSQL CASE statement to assign the samples to integer values based on the text values. The ANOVA module then divides the rows into groups and performs the test.
ANOVA is a general linear model. To determine whether statistical data samples are significantly different from one another, you compare the total variability of the group by the variability between the groups. This is tempered by the number of observations, which is summarized by the degrees of freedom within the groups. The relevant statistic that measures the degree to which the difference between groups is significant is the ratio of the variance between groups divided by the variance within groups, called the F statistic. If it is close to zero, the groups do not differ by much. If it is far from zero, they do.
From statistical theory you can determine the probability distribution of the F statistic if the groups were identical given sampling error. This is given by the p-value. A p-value close to zero indicates it is very likely that the groups are different. A p-value close to one indicates that it is very likely the groups are the same.
-
Run an ANOVA analysis on the average delay minutes between USAir and Delta airlines. The CASE clause assigns USAir flights to group 1 and Delta flights to group 2.
Click a new white rectangle and enter:
%psql.sql  SELECT (MADlib.one_way_anova (
CASE WHEN carrier = 'US' THEN 1
WHEN carrier = 'DL' THEN 2
ELSE NULL
END,
arrdelayminutes
)).* FROM faa.otp_r;
Then press the Play button to execute the query.
-
Run an ANOVA analysis to determine if the average delays for flights from Chicago and Atlanta are statistically different.
Click a new white rectangle and enter:
%psql.sql  SELECT (MADlib.one_way_anova (
CASE WHEN origin = 'ORD' THEN 1
WHEN origin = 'ATL' THEN 2
ELSE NULL
END,
arrdelayminutes
)).* FROM faa.otp_r;
Then press the Play button to execute the query.
-
Run an ANOVA analysis to determine if the differences in average delay minutes from three Delta hubs are significant.
Click a new white rectangle and enter:
%psql.sql   SELECT (MADlib.one_way_anova (
CASE WHEN carrier = 'DL' AND origin = 'ATL' THEN 1
WHEN carrier = 'DL' AND origin = 'MSP' THEN 2
WHEN carrier = 'DL' AND origin = 'DTW' THEN 3
ELSE NULL
END,
arrdelayminutes
)).* FROM faa.otp_r;
Then press the Play button to execute the query.
-
Run an ANOVA analysis to determine if the differences in average delay minutes between Delta and USAir flights from Atlanta are significant.
Click a new white rectangle and enter:
%psql.sql  SELECT (MADlib.one_way_anova (
CASE WHEN carrier = 'DL' AND origin = 'ATL' THEN 1
WHEN carrier = 'UA' AND origin = 'ATL' THEN 2
ELSE NULL
END,
arrdelayminutes
)).* FROM faa.otp_r;
Then press the Play button to execute the query.
From these ANOVA analyses we have learned the following:
- There is a fairly certain difference between delays for USAir and Delta, but the difference is not great.
- Delays from O’Hare seem to be significantly different than from Atlanta.
- There is a large difference between delays at the three Delta hubs.
- There is no significant difference in delays from Atlanta between United and Delta.
Perform Linear Regression
Linear regression shows the relationship between variables. A classic example is the linear relationship between height and weight of adult males in a particular country or ethnic group. MADlib includes modules to perform linear regression with one or multiple independent variables.
The r2 statistic measures the proportion of the total variability in the dependent variable that can be explained by the independent variable.
-
Perform a linear regression to see if there is any relationship between distance and arrival delay. This tests the hypothesis that longer flights are more likely to be on time because the flight crew can make up delays by flying faster over longer periods of time. Test this by running a regression on arrival time as the dependent variable and distance as the independent variable.
Click a new white rectangle and enter:
%psql.sql SELECT ( madlib.linregr(arrdelayminutes,
ARRAY[1,distance])).* FROM faa.otp_c;
Then press the Play button to execute the query.
The regression shows that r2 is close to zero, which means that distance is not a good predictor for arrival delay time.
-
Run a regression with departure delay time as the independent variable and arrival delay time as the dependent variable. This tests the hypothesis that if a flight departs late, it is unlikely that the crew can make up the time.
Click a new white rectangle and enter:
%psql.sql  SELECT ( madlib.linregr(arrdelayminutes,
ARRAY[1,depdelayminutes])).* FROM faa.otp_c;
Then press the Play button to execute the query.
The r2 statistic is very high, especially with 1.5 million samples. The linear relationship can be written as
Arrival_delay = 1.2502729312843388 + 0.96360804792526189 * departure_delayIf you scroll over in the results, the condition_no result is a measure of the mathematical stability of the solution. In computer arithmetic, numbers do not have infinite precision, and round-off error in calculations can be significant, especially if there are a large number of independent variables and they are highly correlated. This is very common in econometric data and techniques have evolved to deal with it.
Learn more about Apache MADlib
MADlib is an Apache open source project on GitHub. You can find source code for the latest release and information about participating in the project in the GitHub repository. Access the MADlib user documentation on the MADlib Web site at http://madlib.apache.org.

